It is really easy to configure Xdebug for a PHP application in Docker. Let’s see how we can configure Xdebug and start debugging using VSCode, PHPStorm, and other IDE.
Configuration Files
Here are the files we need for the configuration-
Project Root
    |
    |-php.Dockerfile
    |-nginx.Dockerfile
    |-php.ini
    |-nginx.conf
|-docker-compose.yml![]() NOTES
NOTES
We have the files in the root directory, but you can put these files in any location in the project. Just make sure to use the proper names for the files(as these names will be used in several places).
Step #1: Create Dockerfile for PHP FPM
We need a docker file for PHP FPM to process the PHP files.
If you already have a Dockerfile then add the following steps to it-
RUN pecl install -o -f xdebug \
    && docker-php-ext-enable xdebug

COPY ./php.ini /usr/local/etc/phpIf you do not have a docker file then create a file named php.Dockerfile and add the following steps-
# php.Dockerfile

# Pull the composer image
FROM composer:latest AS composer

FROM php:8.3-fpm

# Set working directory
WORKDIR /var/www

# Install dependencies
RUN apt-get update && apt-get install -y \
    build-essential \
    libpng-dev \
    libonig-dev \
    libxml2-dev \
    zip \
    curl \
    unzip \
    git \
    libzip-dev \
    libfreetype6-dev \
    libjpeg62-turbo-dev \
    libpng-dev \
    libpq-dev \
    && docker-php-ext-configure pgsql -with-pgsql=/usr/local/pgsql \
    && docker-php-ext-install pdo pgsql pdo_pgsql pdo_mysql mbstring exif pcntl bcmath gd zip

RUN pecl install -o -f xdebug \
    && docker-php-ext-enable xdebug

COPY ./php.ini /usr/local/etc/php

# Clear cache
RUN apt-get clean && rm -rf /var/lib/apt/lists/*

# Remove default server definition
RUN rm -rf /var/www/html

# Install Composer
COPY --from=composer /usr/bin/composer /usr/bin/composer

# Copy existing application directory contents
COPY . .

# Install application dependencies
RUN composer install

# Copy existing application directory contents
RUN chown -R www-data:www-data /var/www

# Change current user to www
USER www-data

# Expose port 9000 and start php-fpm server
EXPOSE 9000

CMD ["php-fpm"]Step #2: Create Dockerfile for Nginx
We also need a nginx image for serving the processed output of the FPM. Create a file named nginx.Dockerfile and add the following steps in it-
# nginx.Dockerfile

FROM nginx:alpine

WORKDIR /var/www

# Copy custom nginx config
COPY nginx.conf /etc/nginx/conf.d/default.conf

# Copy the application code
COPY . .

CMD ["nginx", "-g", "daemon off;"]![]() NOTES
NOTES
This is specifically for the Nginx general setup. There is nothing special in this file for the Xdebug configuration.
Step #3: Config Xdebug in php.ini
Create a file named php.ini. If you already have a php.ini then add the Xdebug configuration in the file-
; php.ini

; General
upload_max_filesize=20M
post_max_size=20M

; Other general configurations

; Xdebug config
[xdebug]
xdebug.mode=debug
xdebug.start_with_request=yes
xdebug.client_port=9003
xdebug.client_host=host.docker.internal

; Use the followign config if you want xdebug log in the terminal
; xdebug.log=/dev/stdout
; xdebug.log_level=0Step #4: Create Nginx Config
Create file nginx.conf file if you don’t already have it. Add the following code to it-
# nginx.conf

server {
    listen 80;
    index index.php index.html;
    error_log  /var/log/nginx/error.log;
    access_log /var/log/nginx/access.log;
    root /var/www; # you may need to change this depending on you application

    location / {
        try_files $uri $uri/ /index.php?$query_string;
    }

    location ~ \.php$ {
        fastcgi_pass php:9000; #name of the sevice that runs the PHP app in docker-compose.yml file
        fastcgi_index index.php;
        include fastcgi_params;
        fastcgi_param SCRIPT_FILENAME $document_root$fastcgi_script_name;
        fastcgi_param PATH_INFO $fastcgi_path_info;
    }

    location ~ /\.ht {
        deny all;
    }
}![]() NOTES
NOTES
This is a general Nginx configuration file. There is nothing in the nginx.conf specific for the Xdebug.
You may need to change the “root” directory in the above configuration depending on your application requirement.
Step #5: Create Docker Compose
Create a file named docker-compose.yml and add the configuration for containers-
# docker-compose.yml

services:
  php:
    build:
      context: .
      dockerfile: php.Dockerfile
    container_name: bigboxcode-php
    restart: unless-stopped
    working_dir: /var/www
    volumes:
      - ./:/var/www
      - ./.env:/var/www/.env # add if required
      - /var/www/vendor # Add if required
    env_file:
      - .env # Add if required
    networks:
      - bigboxcode-network

  nginx:
    build:
      context: .
      dockerfile: nginx.Dockerfile
    container_name: bigboxcode-nginx
    ports:
      - 8000:80
    volumes:
      - ./:/var/www
      - ./nginx.conf:/etc/nginx/conf.d/default.conf:ro
    depends_on:
      - php
    networks:
      - bigboxcode-network

  # Other config for database and other containers

networks:
  bigboxcode-network:
    driver: bridge
Run the application by using the following command-
docker compose up

# if the above command does not work then try the following
# docker-compose upStep #6: Configure IDE
Now we need to configure the IDEs. We are discussing configuration for VSCode and PHPStorm here.
Other IDE configurations should be similar.
VSCode Configuration
Let’s configure the VSCode IDE to work with the Xdebug from the docker container-
Add Configuration
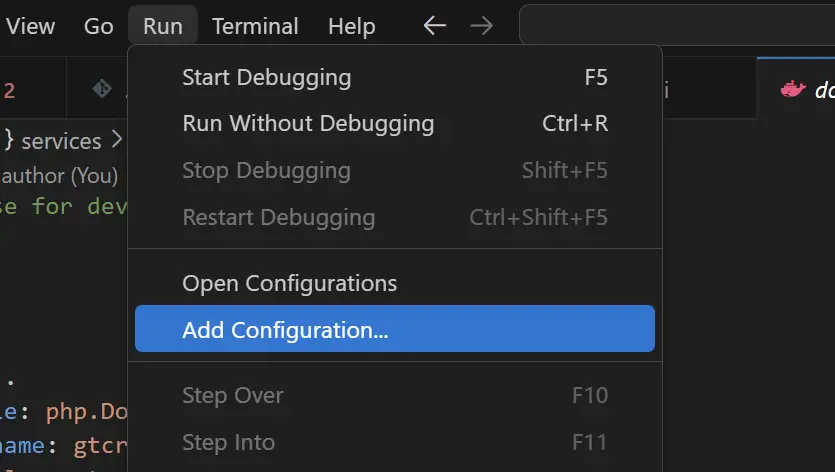
Go to VSCode menu option Run > Add Configuration.
Clicking on this menu option will open a json configuration file from .vscode/launch.json
Write Debug Configuration
Now add the following configuration to the .vscode/launch.json which was open in the last step.
There can be other configurations present in the file already. Our main focus is the “Listen for Xdebug” configuration.
If the “Listen for Xdebug” already exists, then change the configuration with the following-
{
    "version": "0.2.0",
    "configurations": [
        {
            "name": "Listen for Xdebug",
            "type": "php",
            "request": "launch",
            "port": 9003,
            "stopOnEntry": true,
            "log": true,
            "pathMappings": {
                "/var/www": "${workspaceFolder}"
            }
        }
    ]
}Add Breakpoints
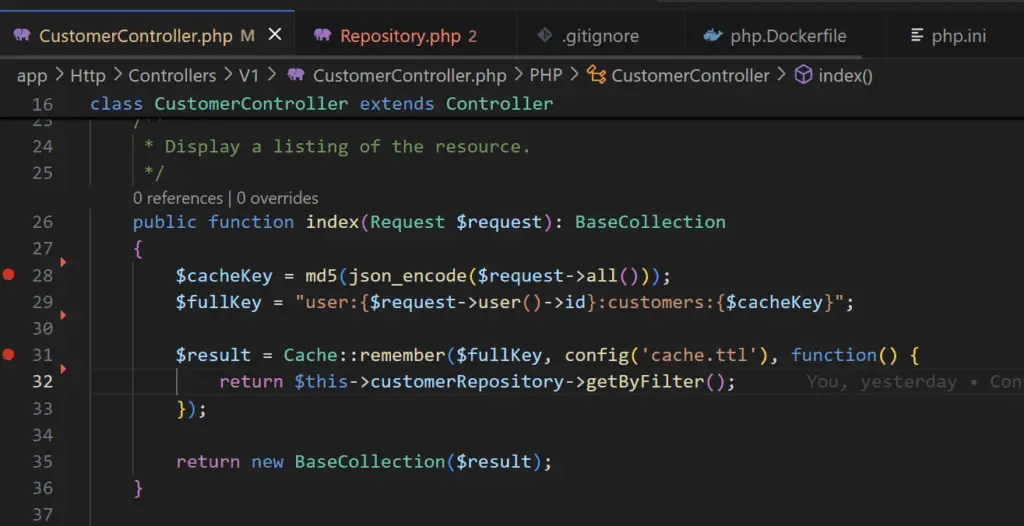
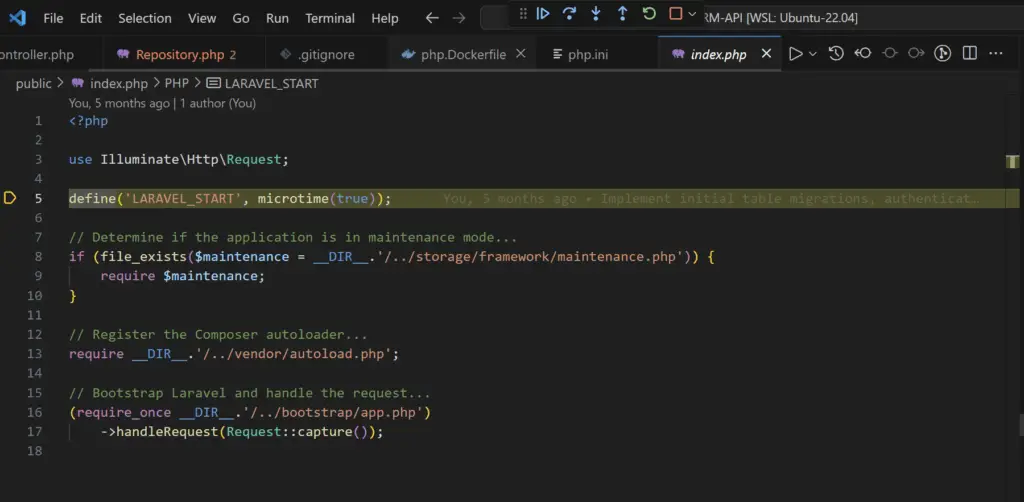
In your source code add some breakpoints by clicking on the left of the line number in VSCode.
Start Debugging Process
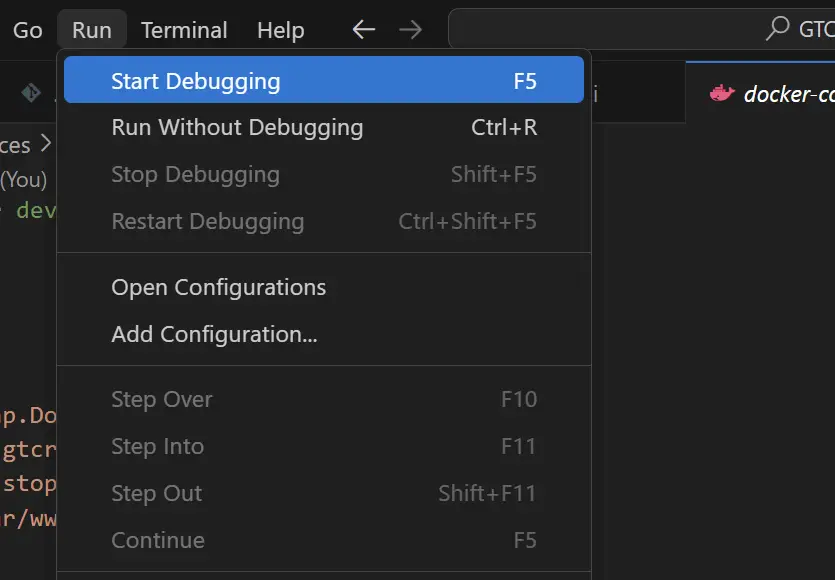
Now we can start the debugging process by using menu option Run > Start Debugging.
Check Debugging Effect
Try to access the application in the web browser, or other clients(like Postman), you will see the IDE navigating to the break points.
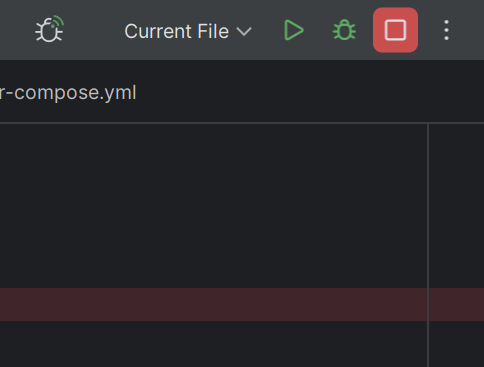
You can see some icons at the top of the IDE, for debugging, going to next step and for stopping debugging.
PHPStorm Configuration
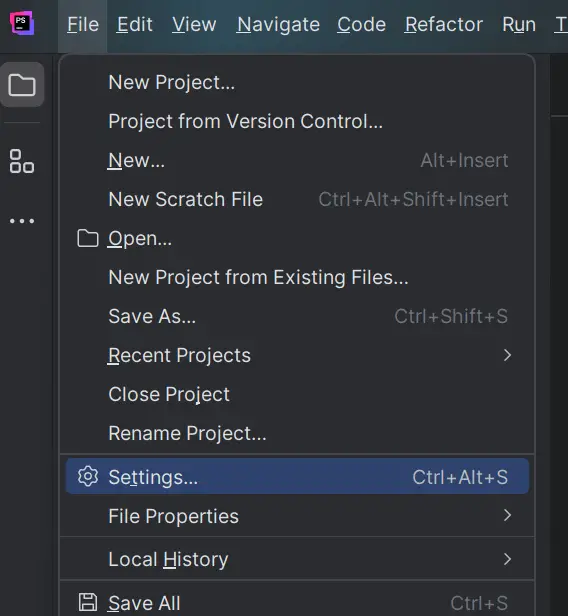
Go to settings from the menu File > Settings.
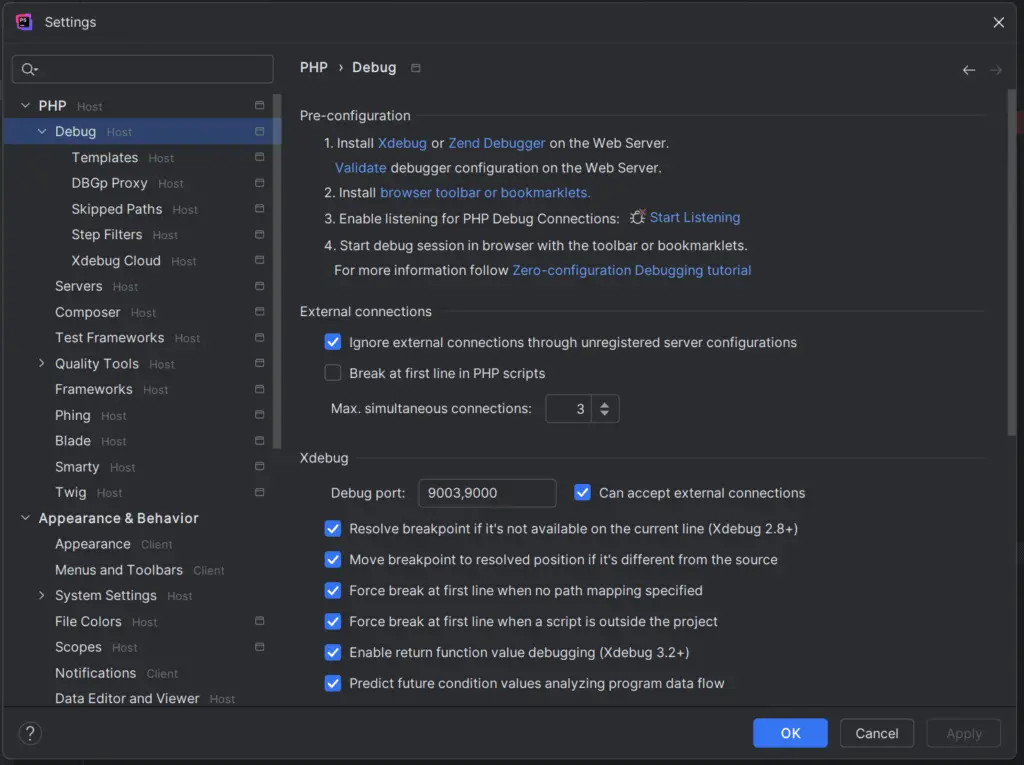
Check the settings under “Debug”, make sure all the settings are as expected-
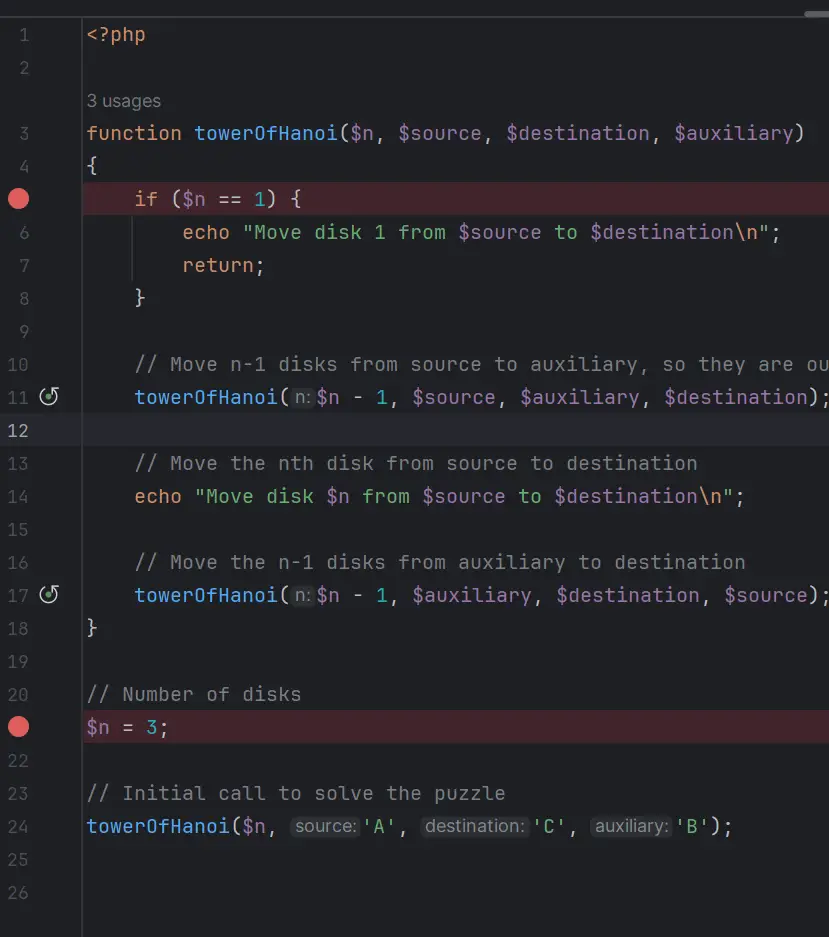
Add some breakpoints-
Start debugging-
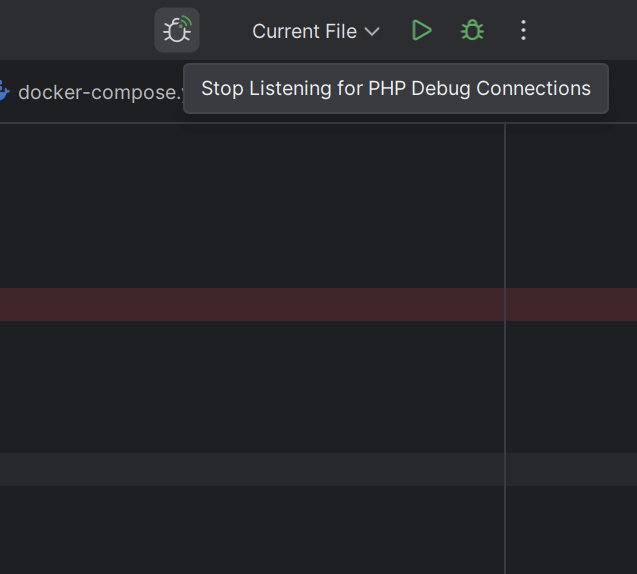
Check the output in the debug window-
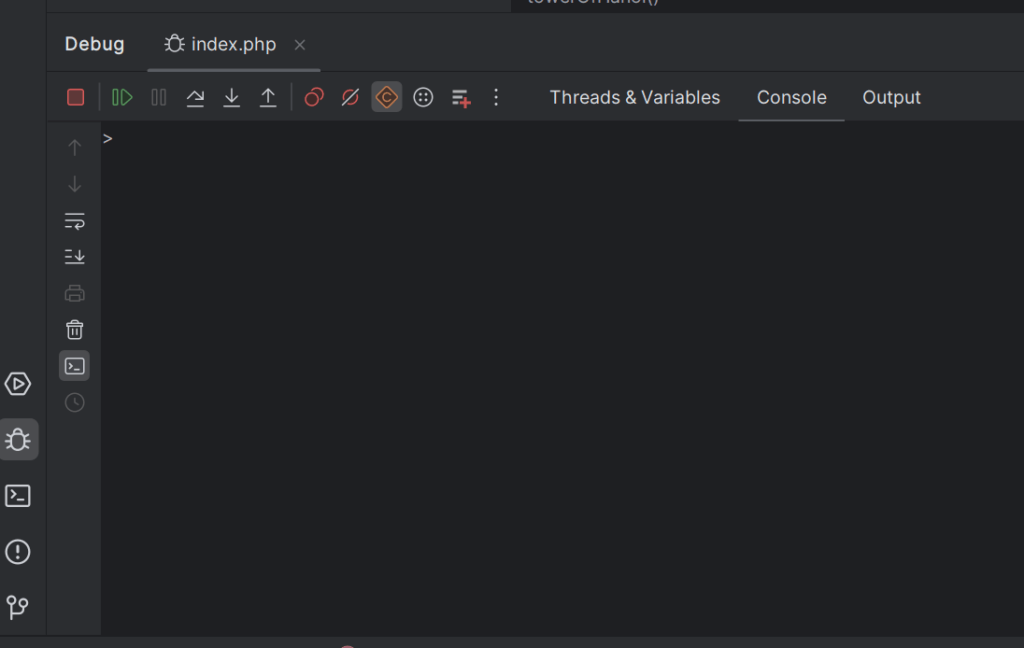
Stop debugging using the “stop” button-
